Size-Adjusting Healthcare Services Market Multiples
As we wrote last week, larger healthcare services companies generally fetch higher valuation multiples – i.e. the purchase price represents a larger multiple of the EBITDA generated by the business. We presented a chart that includes data from health services transactions, and compares the valuation multiple to the size of the business acquired. Here’s the same chart limited to only home-based service businesses.
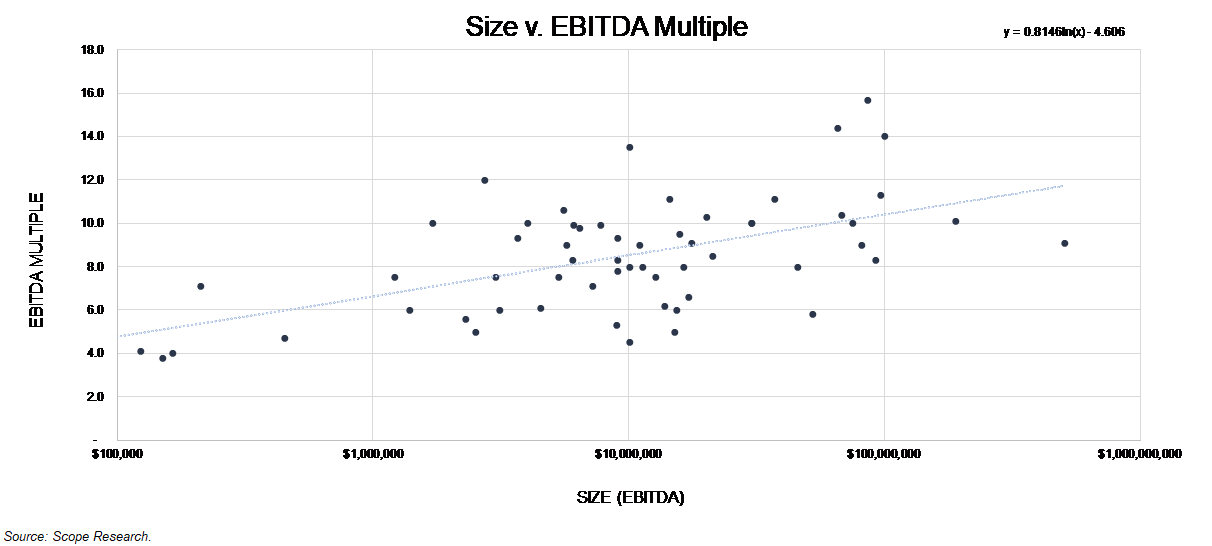
This week, we’ve also included the regression equation from the data that describes the relationship between size and valuation multiple (top right corner of the chart). This is the equation for the line that runs through the data set, and can be used to develop size-adjusted valuation multiples that represent “market” for the industry segment at various sizes, according to the sample. The table below includes market multiples from this sample at various sizes.
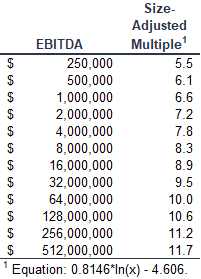
These size-adjusted market multiples are a starting point and a reasonableness check. Each business has different growth opportunities and risk factors, particularly in an industry as complex as healthcare. Factors such as diversity and sustainability of referral sources, out-of-network billing practices, regulatory risks, and capital intensity, among others, can all have a significant impact in specific situations.