Healthcare Industry Cost of Capital: Does it Differ by Segment?
One of the things we track closely is fairness opinions that get filed with the SEC when a public company gets taken private. It's always interesting to see the revenue and adjusted EBITDA projections prepared by management, as well as the comps used in the market approach section. Also interesting, and of relevance to anyone who develops a discount rate on occasion, is the cost of capital used by the bankers who prepare the analyses.
At Scope we keep a database of key information from and links to fairness opinions that we share with our subscribers. We've sliced and diced the data a bit to see what factors seem to impact the cost of capital selected by the preparers the most (technical note - these represent midpoints of the range for each company, and exclude unprofitable and development stage companies). Keep in mind these are publicly-traded companies being taken private, so think large, diversified corporations.
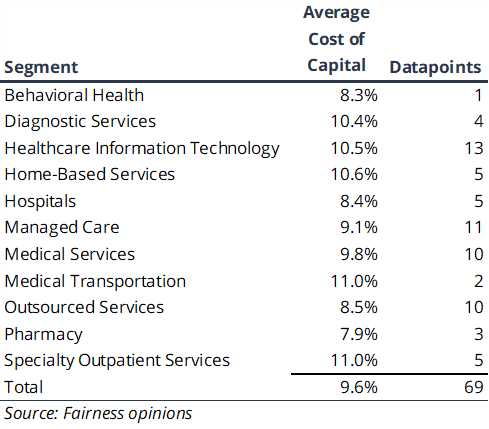
Pharmacy came in the lowest, which was primarily due to the fact that one of the three data points was CVS, which is both the largest and had the lowest selected cost of capital. Tied for highest were medical transportation and specialty outpatient facilities, which may be is influenced by three older deals with high cost of capital estimates. The two more recent specialty outpatient deals actually had cost of capital estimates of 7.0% and 7.5% respectively.
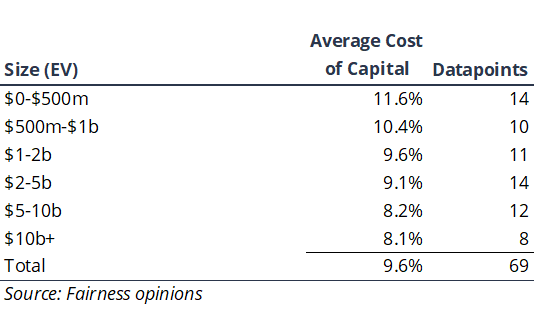
Overall, there isn't much spread between segments, and the outliers seem to be explained better by other factors. Size, for example, clearly has a significant impact. We've previously discussed the impact of size on valuation using a different data set.
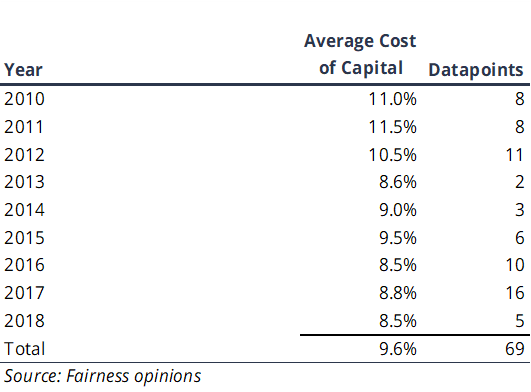
Even timing may have a larger impact, as cost of capital estimates have decreased over the past several years.
Shoot us an email if you want to take a look at the full workbook.